
How measured, live port emissions data turns shore power (onshore power supply) CAPEX into an underwritable asset — a Q1 2026 read on the Greater Bay Area, from a platform built for live data integration
Greensee — Q3 2026 · Port decarbonisation & shore power finance
Executive Summary
Shore power investment, priced from measured data: across three of Asia’s largest container terminals, 13,861 tonnes of at-berth CO₂ in a single quarter could be abated by shore power — worth roughly $0.99M in avoided marine-fuel cost in Q1 2026 alone, and a recurring, financeable line every quarter thereafter.
That port-decarbonisation number did not come from a survey, a questionnaire, or a self-reported ESG return. It was reconstructed from AIS vessel signals across the Greater Bay Area — Shenzhen, Guangzhou and Hong Kong — and reconciled to ISO 14083 and the IMO Fourth GHG Study.
The figures below are a fixed Q1 2026 snapshot from the public demo. The platform itself runs on live data integration — continuous AIS feeds and terminal operational data — so the same emissions baseline, shore-power abatement and fuel-cost saving update in real time on a production deployment.
For an infrastructure investor or lender, that distinction is the whole point. A shore power (onshore power supply, or OPS — also known as cold ironing) CAPEX case built on measured berth activity can be underwritten. A case built on estimates cannot.
The Number That Should Stop You Scrolling
In Q1 2026, the three Greater Bay Area terminals emitted 39,347 tonnes of CO₂ at berth — the hotelling load from auxiliary engines and boilers while vessels sit alongside.
Of that, 35% — 13,861 tonnes — is abatable by shore power. The energy required to displace it is 45,743 MWh of OPS supply. At current marine fuel prices, replacing that burn with grid electricity represents approximately $0.99M of fuel-cost saving in the quarter, before any carbon price is applied.
Put annualised, that is a multi-million-dollar recurring operating saving attached to a defined, measurable infrastructure investment. This is the shape of a business case a lender recognises: a known cost to build, a measured benefit to capture, and a data trail that survives due diligence.
Where the Opportunity Actually Sits
The headline masks an unusually concentrated opportunity. Hong Kong holds 68% of the entire region’s shore-power potential — 10,920 abatable tonnes in the quarter — and has no OPS infrastructure in place today.
Its neighbours tell the opposite story. Shenzhen and Guangzhou are both OPS-equipped, yet each shows only 23–24% of its berth footprint as abatable, because their vessel profiles and grid intensities differ.
- Hong Kong (HKHKG) — 26,852 t CO₂ at berth, 10,920 t abatable (41%), 4,213 berth calls. Status: no OPS infrastructure.
- Shenzhen (CNSZX) — 11,157 t CO₂ at berth, 2,637 t abatable (24%), 930 berth calls. Status: OPS-equipped.
- Guangzhou (CNNSA) — 1,338 t CO₂ at berth, 304 t abatable (23%), 358 berth calls. Status: OPS-equipped.
For capital allocation, this is the useful finding: the single largest, cleanest, most concentrated OPS investment in the Greater Bay Area is a greenfield one, and it can be sized precisely because the demand behind it is already being measured.
Why Measured Beats Surveyed
Port infrastructure decisions have historically leaned on periodic studies and self-reported operational data. That is adequate for planning. It is not adequate for financing, where the question is not “what does the operator estimate?” but “what can be independently verified, and will it still be true after the loan closes?”
Greensee reconstructs each terminal from AIS alone into a live digital twin, then measures what the assets actually do:
- 5,501 berth calls across the region in Q1 2026
- 57,478 berth-hours alongside
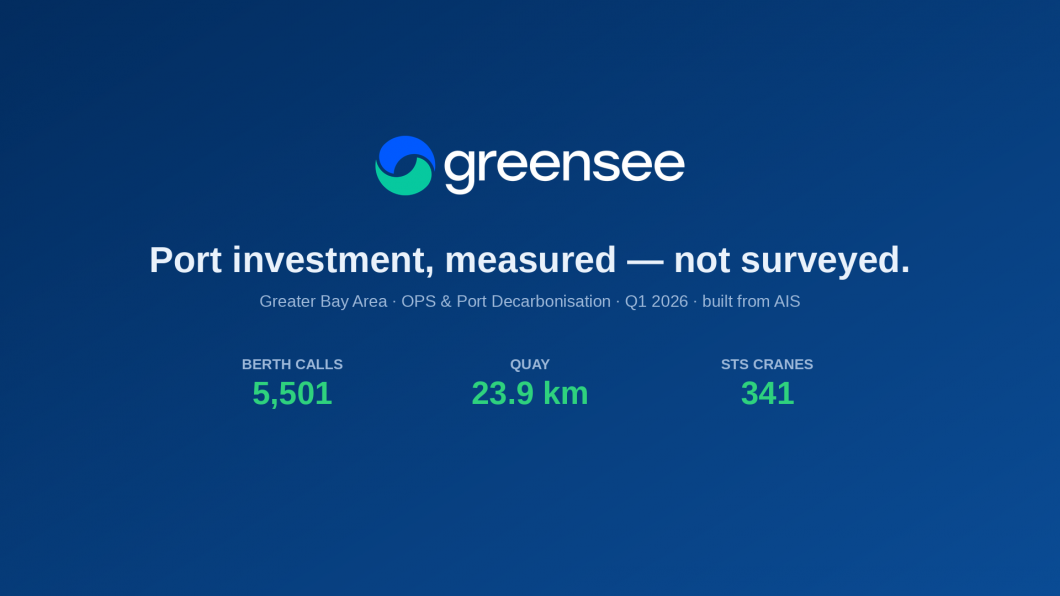
- 23.9 km of quay and 341 ship-to-shore cranes
- Grid carbon intensity per terminal, which determines how much OPS genuinely saves — Hong Kong’s cleaner grid (0.37 kgCO₂e/kWh) makes its shore power more effective than Shenzhen’s or Guangzhou’s (0.52).
The demo shows a single quarter, but the engine behind it does not stop at quarter-end. The emissions baseline, the abatement potential and the fuel-cost saving are not a one-off report — they can be re-verified continuously, the difference between financing estimated performance and financing measured performance.
From a Q1 Snapshot to a Live Feed
The public demo is a fixed Q1 2026 dataset — deliberately, so the numbers can be checked against a defined period. The production platform is built for live data integration.
The same model ingests continuous AIS vessel feeds and, where a terminal chooses to connect them, its own operational systems — berth occupancy, energy metering and shore-power draw. That turns a quarterly benchmark into real-time port emissions monitoring: at-berth CO₂, shore-power abatement potential and fuel-cost saving that refresh as vessels arrive and depart, not once a year in a sustainability report.
For capital, live integration changes what the data can secure. A one-off study supports a decision at a point in time. A continuously updated, auditable feed supports covenants, sustainability-linked margin ratchets and ongoing carbon-cost monitoring across the life of a facility — the emissions equivalent of live financial reporting rather than annual accounts.
The Physics Is Why the Numbers Are Bankable
The abatement figure is not a statistical guess. Every tonne is derived from vessel-specific hotelling loads, auxiliary and boiler energy demand, and the local grid’s own carbon intensity for the electricity that replaces it — which is why the model never claims 100% abatement. Some load is boiler heat that cannot be electrified; some carbon simply moves to the grid.
Grounding the numbers in physical reality, rather than in reported averages, is what makes them investment-grade. They are auditable to ISO 14083, the GLEC Framework v3.2 and the IMO Fourth GHG Study, and they reconcile to a CPPI-style performance ranking of the terminals. For a lender, that traceability is the difference between a marketing figure and a covenant.
What an Investor or Lender Can Do With This
The same continuously measured foundation supports the instruments green infrastructure capital already uses:
- OPS CAPEX underwriting — size a shore-power investment against measured berth demand, not projected throughput.
- Sustainability-linked structures — tie margin to verified, quarter-on-quarter carbon abatement rather than annual self-reporting.
- Carbon-cost exposure — quantify the recurring emissions liability a terminal carries before regulation prices it, and the CAPEX that retires it.
- Portfolio comparison — rank assets across a region on a consistent, physics-based basis before committing capital.
In each case the value of the data is no longer operational. It is financial. Measured berth emissions become a de-risked input to a capital decision.
A surveyed number tells you what a port believes. A measured number tells you what you can underwrite. The berth is now bankable.
See It on Your Own Ports
The Greater Bay Area dashboard is online now as a Q1 2026 demo, and the same model can be run — with live data integration — on any terminal that generates AIS signal. If you are weighing shore power CAPEX, sizing carbon-cost exposure, or validating a port business case, we will walk you through the numbers on a call and show how a live feed would look on your assets.
Book a walkthrough of the dashboard: https://d282vqxoa03s0c.cloudfront.net/
Methodology: figures shown are a fixed Q1 2026 snapshot, reconstructed from AIS vessel data; the production platform supports live data integration and real-time updates. Abatement, energy and fuel-cost figures derived to ISO 14083, GLEC Framework v3.2 and the IMO Fourth GHG Study. Performance ranking is an internal CPPI-style proxy, not the official World Bank Container Port Performance Index.