
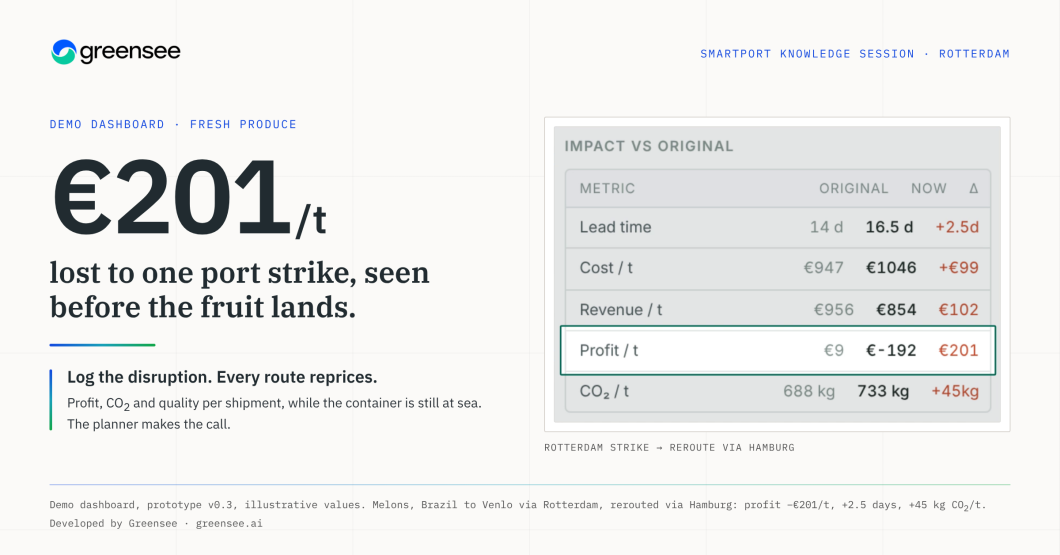
A port strike can cost a fresh-produce shipment around €200 a tonne in margin, and most planners find out only when the container arrives. At the SmartPort knowledge session in Rotterdam, a demo dashboard developed by Greensee showed how to price that disruption while the cargo is still at sea.
SmartPort knowledge session · WTC Rotterdam · 29 October 2026 · Decision support for fresh produce
The demo dashboard in under two minutes. Prototype v0.3, values are illustrative.
Value lost at sea, found on arrival
Fresh fruit loses value every day it spends in transit. Yet the quality and margin of a shipment are usually checked only at the destination, once the routing decisions can no longer be changed. Around 14% of the world’s food is lost between harvest and retail, before it ever reaches a shop (FAO, The State of Food and Agriculture 2019). A lack of effective refrigeration alone accounts for about 526 million tonnes of food production lost each year, roughly 12% of the total (UNEP and FAO, Sustainable Food Cold Chains, 2022).
When a port closes or a ripening problem appears mid-voyage, the planner faces a choice between ports, onward modes and buyers. Without a view of what each option costs in money, carbon and quality, that choice is made on instinct.
What the demo dashboard does
The dashboard weighs profit, CO₂ and expected quality for each shipment while it is still moving. It works in four steps.
- Set up the shipment. Choose the product, the origin and the port, and which transport is allowed after the port: road, rail or barge.
- Compare the routes. The dashboard ranks the options on profit, CO₂ and lead time, with expected quality and the source of emissions alongside.
- Log an event. A strike, a delay, a ripening risk or a spot-market opportunity is recorded against the shipment while it is at sea.
- See the impact. Every route is recalculated straight away and compared with the original plan.
Worked example: a strike closes Rotterdam
The demo follows a shipment of melons from Brazil to Venlo. Before any disruption, the best option is ocean to Rotterdam and road to Venlo: 14 days door to door and 688 kg of CO₂ per tonne.
While the container is still at sea, a strike closes Rotterdam. The planner logs the event and picks Hamburg instead. The dashboard reprices every route at once.
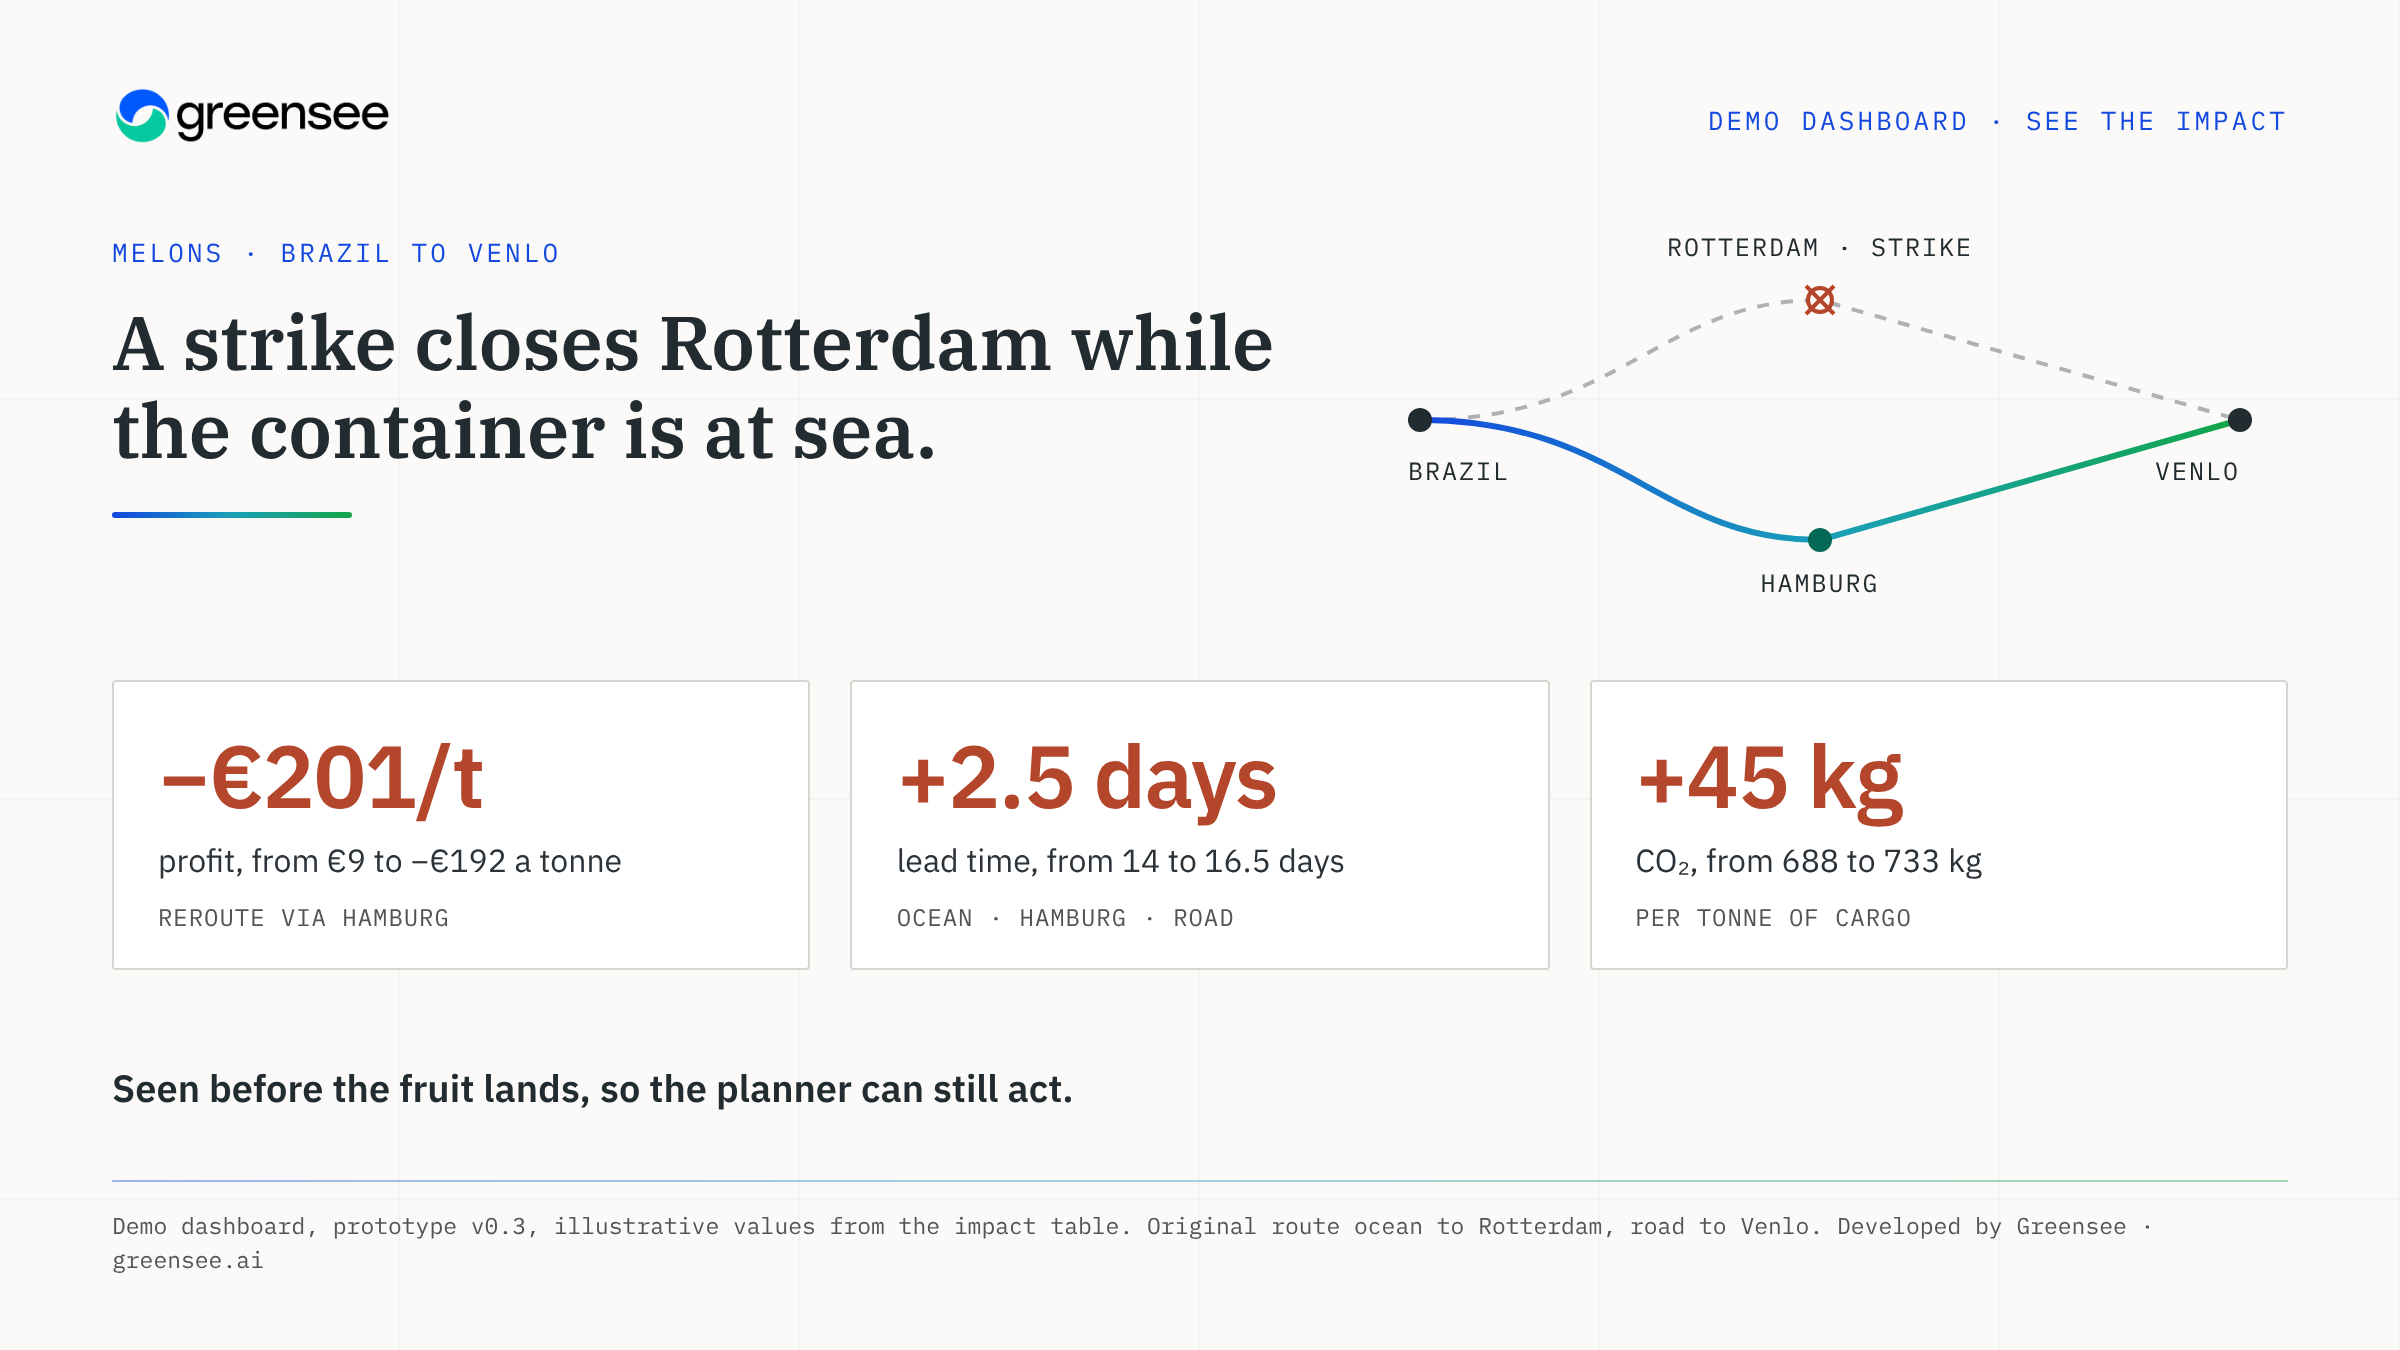
| Measure | Via Rotterdam | Via Hamburg | Change |
|---|---|---|---|
| Lead time | 14 days | 16.5 days | +2.5 days |
| Profit per tonne | €9 | −€192 | −€201 |
| CO₂ per tonne | 688 kg | 733 kg | +45 kg |
The reroute turns a small profit into a loss of about €200 a tonne, before the fruit has landed. That gives the planner time to act: renegotiate with the buyer, switch the onward mode, or sell part of the load on the spot market. The figures are the prototype’s illustrative values, chosen to show the method rather than a real shipment.
Why it matters for importers, ports and hinterland operators
The cost of a problem is visible before the cargo arrives. Margin is protected by decisions taken at sea, not by claims filed on arrival.
Onward transport is compared on money and carbon together. Road, rail and barge from the port sit side by side, so a lower-carbon choice is never a blind trade against profit.
The planner makes the call. The dashboard shows the options and their consequences. It does not decide for the people who know the cargo, the buyers and the lanes.
The research behind it
The dashboard was built in a research project with SmartPort, Fresh Produce Centre, Maastricht University and Wageningen Food & Biobased Research, supported by TKI Dinalog. Greensee developed the dashboard and contributed to the SmartPort knowledge session at the World Trade Center Rotterdam remotely, with the explainer video above.
See it on your own lanes
Greensee can walk you through the dashboard with your own products, ports and onward modes, and show what a disruption would cost on the lanes you run today.
Book a walkthrough: contact@greensee.ai
Sources and method. Demo dashboard, prototype v0.3, developed by Greensee. All shipment figures are illustrative values from the prototype’s impact table (melons, Brazil to Venlo, Rotterdam strike, reroute via Hamburg) and do not describe a real shipment. Food loss between harvest and retail: FAO, The State of Food and Agriculture 2019. Food production lost through lack of refrigeration: UNEP and FAO, Sustainable Food Cold Chains: Opportunities, Challenges and the Way Forward, 2022.