
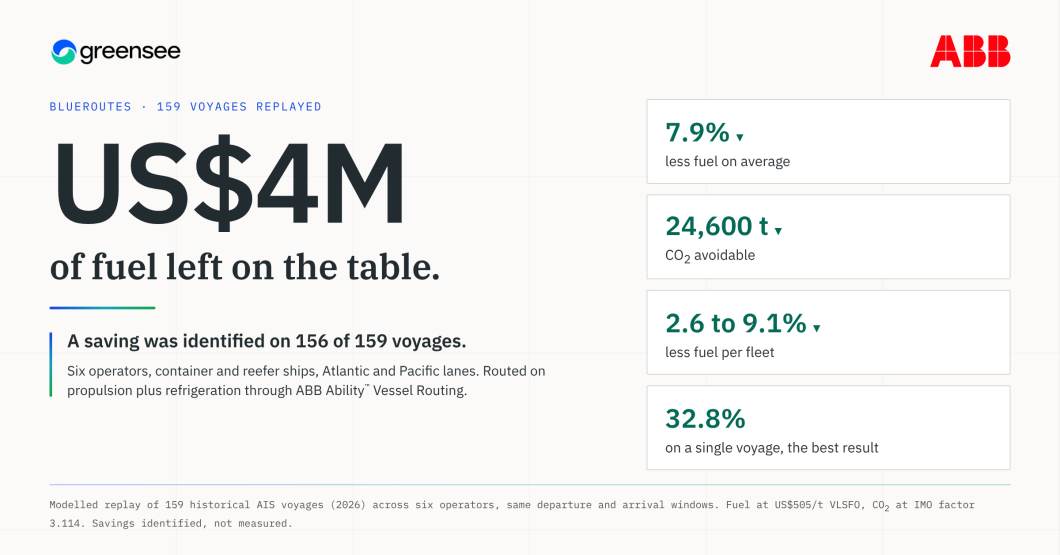
About US$4M of fuel left on the table across 159 replayed voyages. Blueroutes by Greensee identified a saving on 156 of them by pricing reefer fuel consumption, the fuel that keeps cargo cold, and delivers the route through ABB Ability™ Vessel Routing.
Greensee × ABB · October 2026 · Reefer-aware vessel routing
Why reefer fuel consumption goes unpriced
On a ship that carries reefers, fuel goes two ways: into the propeller and into keeping the cargo cold. About a fifth of a reefer ship’s fuel goes on refrigeration (Sustainable-Ships, 2026). That share is not fixed. Sea and air temperature, sun and time at sea all change what the reefers draw, so the route changes reefer fuel consumption too.
Weather routing and most voyage optimisation tools optimise the hull against wind, waves and currents. Reefer telematics reports temperatures and alarms. Carbon calculators work from averages. None of them puts a price on the refrigeration load. Blueroutes does, and plans the route on propulsion and refrigeration together.
What we replayed
159 historical voyages from six operators: 124 container-ship and 35 reefer-ship voyages on North Atlantic, transatlantic, Europe to South America and Pacific lanes. Each voyage was rebuilt from AIS data and the weather the ship actually met, then run through Blueroutes under the same conditions.
- Same window. Departure and arrival times match the real voyage, so no saving comes from sailing slower.
- The captain’s choice respected. On the 62 North Atlantic voyages, alternatives stayed inside the captain’s own corridor and weather limits.
- One price. All fuel is valued at US$505/t VLSFO.
The replays cover about 20 ships, out of roughly 6,700 container ships in service worldwide (Alphaliner, March 2026). They are modelled, so the results are savings identified, not savings made, and they are not scaled up to the wider fleet.
The results
| Measure | Result |
|---|---|
| Voyages replayed | 159, across six operators |
| Voyages with a saving identified | 156 (98%) |
| Fuel identified | about 7,900 t |
| Value at US$505/t VLSFO | about US$4M |
| Average fuel reduction | 7.9% |
| Range per fleet | 2.6% to 9.1% |
| Best single voyage | 32.8% |
| Average per voyage | about 50 t of fuel, about US$25k |
| CO₂ avoidable | about 24,600 t |
The per-voyage figure varies with ship size and lane. The 32.8% result is a single voyage, the top of the range, not a typical outcome.
Where the fuel was hiding
On almost every voyage. A saving was identified on 156 of 159 voyages, across six operators with different fleets, lanes and seasons. No fleet averaged below 2.6%.
In the reefers. On the dedicated reefer ships in the set, 38% of the fuel identified came from refrigeration rather than propulsion. A router that leaves the reefers out cannot find that share.
Off the shortest path. On one fleet, the Great Circle route, the shortest line between two ports, would have burned more fuel than the route sailed on 13 of 23 voyages. Shortest is not cheapest once reefer fuel consumption is counted.
Carbon from the same numbers
Carbon follows the fuel. At the IMO factor of 3.114 t of CO₂ per tonne of fuel, the fuel identified corresponds to about 24,600 t of avoidable CO₂, with no separate carbon model. That carbon now has a price. Under the EU Emissions Trading System, shipping companies surrender allowances for 100% of their in-scope emissions from 2026 onwards. Every tonne of fuel identified carries a carbon cost as well as a bunker cost.
How it reaches the bridge through ABB Ability™ Vessel Routing
Blueroutes does not ask an operator to change its routing service. It adds the refrigeration load to ABB Ability™ Vessel Routing, and the route reaches the bridge through the service the crew already uses. There is no new system to install on board.
Greensee and ABB are finalists in the Mobility category of the Solar Impulse Foundation’s Pioneer Awards 2026, with the final in Lausanne on 26 November. This replay extends the first Blueroutes results to 159 voyages and six operators.
Get a free replay of your own voyages
The same replay runs on your own history before any commitment. Send vessel names or IMO numbers for the services you want to test, and typical reefer counts if you have them. You get a voyage-by-voyage comparison of the route sailed and the Blueroutes route, in tonnes of fuel and in dollars, with the break-even reefer count below which reefer-aware routing is not worth it on that lane.
If the savings are there, you’ll see them. If not, you’ll know that too.
Get a free demo: contact@greensee.ai
Sources and method. Modelled replay of 159 historical AIS voyages (2026) across six operators, comparing the routes sailed with Blueroutes total-fuel routing (propulsion and refrigeration) in the same departure and arrival windows. Fuel valued at US$505/t VLSFO. CO₂ at 3.114 t per t of fuel (IMO). Average reduction is fuel-weighted over the five datasets with baseline tonnes. Savings identified, not measured. Refrigeration share of fuel: Sustainable-Ships (2026). World container fleet: Alphaliner Global Fleet Snapshot, 6,706 active ships, March 2026. EU ETS maritime phase-in: Directive (EU) 2023/959, 40% of 2024, 70% of 2025 and 100% of 2026 emissions.